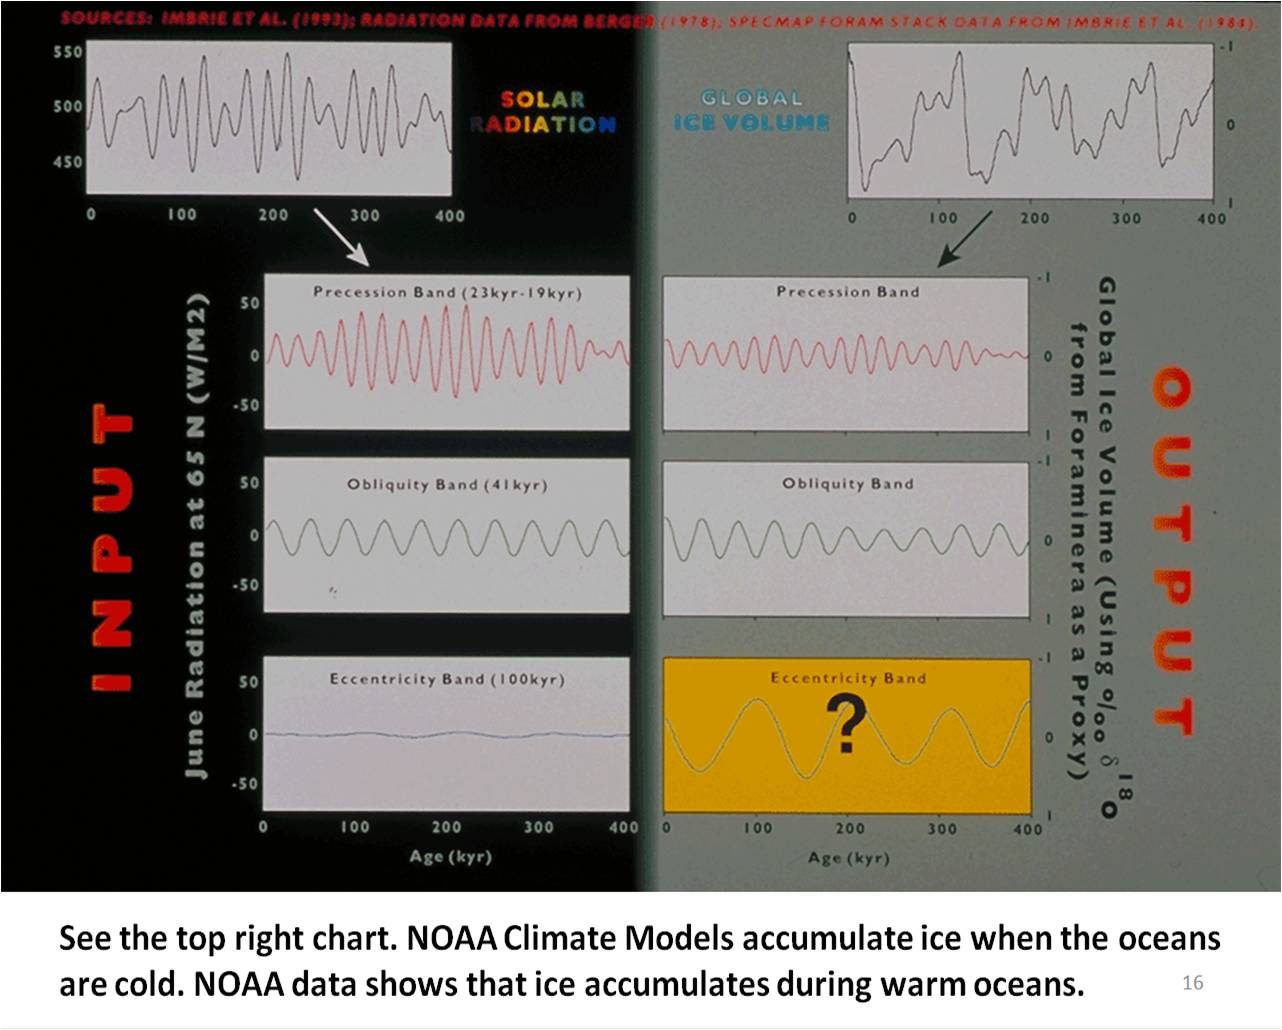
This NOAA chart also shows the improper ice volume. It shows that ice volume reached a maximum, twenty thousand years ago and that miles thick ice sheets melted quickly while the earth warmed. It also shows the solar cycles and orbit cycles that they believe are responsible for the ice age and global warming cycles. I fail to see how they make a connection between the data presented on this chart and the actual climate cycles. Their Climate Theory is very wrong about ice volume.